Ore deposit maps are fundamental tools for understanding mineral deposits. More than just a visual representation of rock types, these maps integrate geological history, mineralization processes, and structural controls, guiding mineral exploration and development.
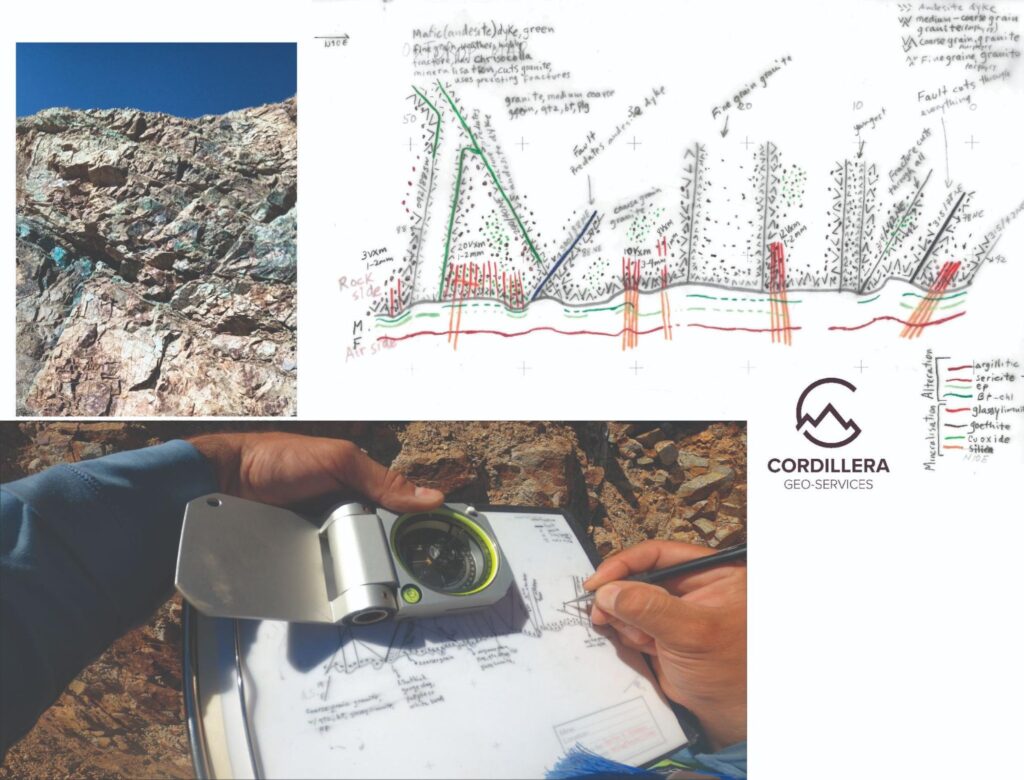
Great geological exploration maps are made and fine-tuned in the field, not in the office. When executed in the “Anaconda Style,” ore deposit mapping helps to understand zoning, track the time-space evolution of mineralizing systems, and analyze hydrothermal alteration. A well-constructed map can make the difference between successful mineral exploration and costly miscalculations.
One of the first aspects an ore deposit map must capture is the spatial distribution of lithology, geological structures, alteration, and mineralization. Different zones within a deposit reflect variations in ore composition, alteration intensity, and structural control. A great ore deposit map will be the foundation for other phases of exploration, such as geochemical studies, geophysical surveys, and eventually exploration drilling.
For example, in Goldfield, Nevada, a high-sulfidation epithermal gold system, mapping alteration halos provides insight into the proximity of ore-bearing fluids. Similarly, the Robinson District in Nevada, which hosts porphyry copper deposits, skarn, carbonate replacement, and distal gold-silver ores, requires deposit-scale detailed mapping to understand mineral zoning. For instance, the Robinson porphyry Cu-(Mo-Au) system is dismembered (faulted and tilted), and the detailed mapping of the rock types, alteration, and structure, as shown in the figure below, allows an effective extraction and mining operation.
The ability to delineate these zones directly impacts exploration and development strategies. If mineralization follows well-defined structural or lithological boundaries, drill holes can be strategically placed to maximize resource definition. By carefully mapping zonation, you can predict where the highest ore concentrations are likely to occur and avoid unnecessary drilling in barren zones.
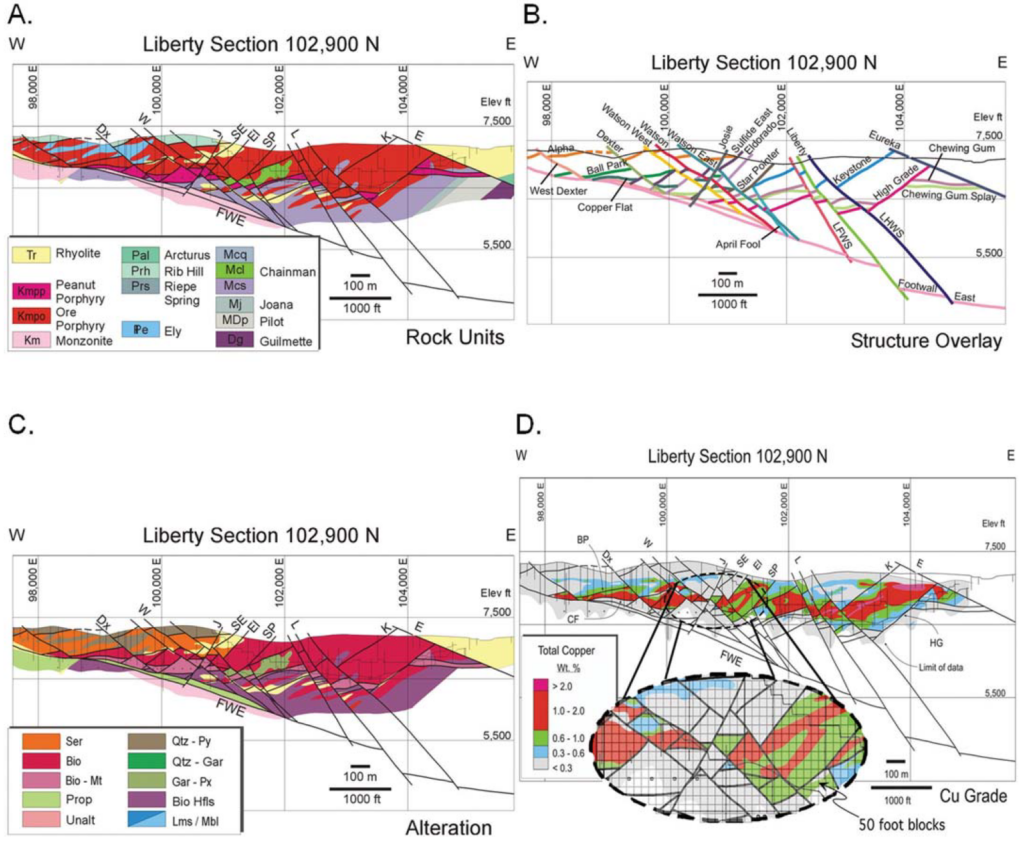
East-west geologic cross section through the middle of the Liberty pit with overlays showing (rock type), (b) structure, (c) alteration, and (d) copper grade (from Seedorf et al., 2015).
Structural and Lithological Framework
A thorough ore deposit map must include detailed structural and lithological data. The structural framework—faults, folds, and other deformation features—often controls the emplacement, preservation, or exposure/exhumation of mineralization.
In some cases, faults act as conduits for ore-bearing fluids, while in others, they disrupt or offset mineralized bodies, complicating resource estimation.
In the Tonopah district of Nevada, a low-sulfidation epithermal silver-gold system, structural mapping reveals the role of extensional faults in localizing ore shoots. Understanding these fault systems allows us to predict the distribution of high-grade zones and optimize geophysical exploration and drill targeting.
Similarly, lithological mapping is crucial for identifying host rock units that influence mineralization styles. At Eureka’s McCullough Butte, mineralization is associated with the top of a F-W-Zn-Be-(Mo-Sn) system, where host rock lithology plays a defining role in ore formation.
Integrating structural and lithological data into an ore deposit map ensures that all key geological factors influencing mineralization are considered. This level of detail is vital for developing accurate geological exploration and resource models and making informed decisions about mine planning and development.
Hydrothermal Alteration
The relationships between mineralization and hydrothermal alteration are another key component of ore deposit maps. Hydrothermal alteration patterns often serve as vectors toward ore deposits, indicating past fluid flow pathways and the physicochemical conditions under which mineralization occurred.
At Birch Creek, California, mapping the distribution of F-Be-W-(Zn) greisen and skarn systems reveals the interaction between mineralizing fluids and host rocks. Similarly, in Humboldt, Nevada, where iron oxide copper-gold (IOCG) occurrences exist, alteration mapping helps distinguish between economic and barren zones. Capturing these alteration patterns on a map provides essential clues for geologists working to extend known deposits or discover new ones.
Beyond alteration mapping, economic geological maps should incorporate phase equilibria of alteration minerals to understand ore formation conditions better. This approach refines exploration models by highlighting mineralogical transitions that coincide with ore deposition, ultimately improving targeting efforts.
Time-Space Evolution of Mineralizing Systems
Economic geological maps should also reflect the evolution of mineralization over time. The sequence of geological events leading to ore deposition can help in predicting undiscovered resources. In the Eureka district of Nevada, multiple overlapping mineral systems coexist, including Carlin-type gold deposits, porphyry Mo-Cu deposits, and replacement Zn-Pb-Ag deposits.
Mapping these different stages of mineralization provides crucial information about the timing of ore formation and the potential for further discoveries.
Understanding the evolution of mineralizing systems also allows you to refine your exploration models. If a district has undergone multiple mineralizing events, certain areas may be more prospective than others due to structural reactivation or remobilization of ore minerals.
The presence of younger, post-ore faulting can influence the current distribution of economic mineralization, affecting both exploration tactics and resource estimation. The Resolution and Superior East porphyry copper deposits are examples of structurally dismembered deposits that might have been originally related to one another, as demonstrated by Favorito and Seedorff (2024) in the figure below.
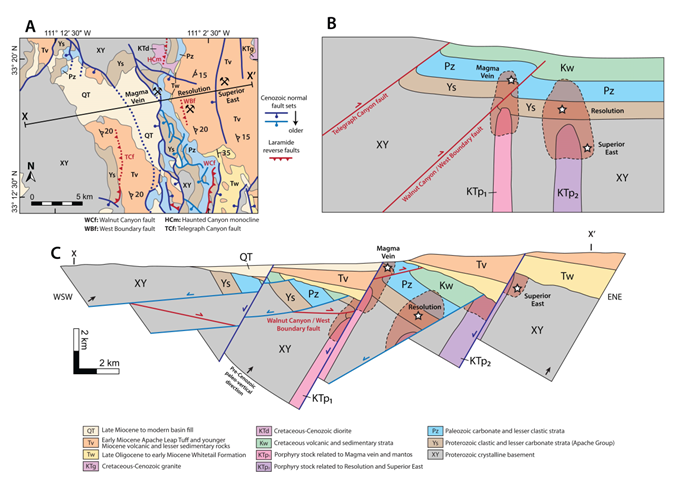
An example showing the dismemberment of a porphyry copper deposit (taken from Favorito and Seedorff, 2024 in Economic Geology. 2024;119(6):1261-1288. doi:10.5382/econgeo.5099). (A) Geologic map of the Superior district, (B) The restored cross section of line X-X′ depicts the geology of the area just prior to the Cenozoic extension, and (C) Modern cross section of line X-X′.
Ore deposit mapping is an ageless way to discover orebodies.
It is a dynamic tool that synthesizes lithology, mineralization zoning, temporal evolution, hydrothermal alteration, and structural frameworks. By capturing these essential elements, you can build a comprehensive understanding of ore systems, guiding both exploration and mining operations. Whether working with high-sulfidation or low-sulfidation gold deposits, porphyry copper systems, or polymetallic replacement deposits, the same principles apply: a well-constructed geological map is the foundation of successful mineral exploration and resource development. The geochemical, geophysical, and drilling campaigns build on this map.
Ore deposit maps continue to evolve with modern mapping techniques and increasingly sophisticated data analysis tools. However, their core purpose remains unchanged—to provide a clear and actionable geological framework that enhances the discovery and extraction of valuable mineral resources.
Do you need help in your project? Let’s talk.